
Sidebar
The Sidebar
The sidebar holds a set of panels with information related to the transactions shown in the result list. Each of the panels can be folded by clicking on the triangle on the left of the panel titles. In the screenshot below, only the panel titled "Transaction statistics" has been unfolded:
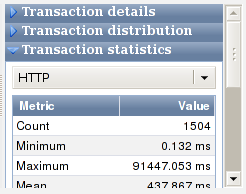
Figure: Sidebar with an unfolded panel
Which panels are displayed in the sidebar (or if no sidebar at all is shown) is documented in the section on the sidebar entry in the Icon bar.
Transaction details
Clicking on a row in the results table will populate the "Transaction details" panel with detailed information about the particular measurement.
Figure: Transaction details in the sidebar
The following attributes are always shown:
- "Name"
- is the transactions' name
- "StartDate"
- is the date when the measurement started. The display format selected in the Preferences is used
- "StartTime"
- is the time when the measurement started. The display format selected in the Preferences is used.
- "Response time"
- is the response time in the unit selected in the Preferences
- "Status"
- is the ARM transaction status. The corresponding cell in the "Value" column will be rendered in green for "GOOD", in yellow for "ABORTED", in red for "FAILED" and in gray for "UNKNOWN" transaction status
- "System address"
- is the (unique) host to which the measurement belongs
- "StopDate"
- is the date when the measurement stopped. The display format selected in the Preferences is used
- "StopTime"
- is the time when the measurement stopped. The display format selected in the Preferences is used
After the mandatory attributes, there may be several attribute-value pairs, displayed with a light blue background color. Those are user-defined attributes. In our example screenshot, there are three of them: Album, Tracks and DiscKey.
Transaction distribution
This panel shows the frequency of occurrence for the entity selected in the drop-down-box (in our example it is "Transactions"). If you select "Transactions", it will show you the frequency of occurrence of the transaction types with respect to the selection criteria. Our example screenshot will illustrate this, we had filtered for applications of the type "PyCDDB":
Figure: Transaction distribution in the sidebar
We are shown that 38.5% of the transactions are of the type "Fetch-Tracks". There are four other types of transactions: "DB-Connect", "CDDB-Query", "Fetch-Discs" and "Generate-Output". Each of the types occurs with the same frequency, which accounts for 15.4% of the transactions. For better legibility, the colors used in the pie-chart are listed below the chart together with the percentages.
Selecting "Applications" in the drop-down-box will show you the frequency of occurrence for the ARM applications.
Selecting "Systems" in the drop-down-box will show you the frequency of occurrence for the ARM system addresses.
Selecting "Status" in the drop-down-box will show you the frequency of occurrence for the ARM transaction status:
Figure: Showing frequency of occurrence of ARM transaction status
Transaction statistics
This panel shows statistical information pertaining to the transaction type selected in the drop-down-box. A special case for the transaction type is "All", which means that the statistical data shown has been computed for all known transaction types. Our example screenshot uses the transaction type "Fetch-Tracks":
Figure: Transaction statistics for "Fetch-Tracks"
The transaction(s) chosen in the drop-down-box will be highlighted in the results table with the color according to the interval in which the particular transaction lies (e.g., transactions with a response time more than three standard deviations from the mean will be rendered with a red background).
The metrics in the transaction statistics table have the following meaning:
- "Count"
- is the total number of measurements the statistics are based on
- "Minimum"
- is the minimum response time
- "Maximum"
- is the maximum response time
- "Mean"
- is the mean response time
- "Median"
- is the median response time
- "Percentile"
- is the selected percentile response time. Note the percentile
text is rendered with light yellow background color which indicates
that it is possible to click on it, a selection box is opened to
select the percentile to display:
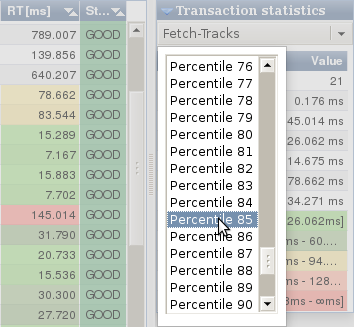
Figure: Transaction statistics percentile selection - "Deviation"
- is the standard deviation, assuming the measurements are normally distributed
- " Mean"
- shows the interval and background color used to highlight cells in the column "RT" in the results for values that have a response time less than the mean value
- "1-σ range"
- shows the interval and background color used to highlight cells in the column "RT" in the results for values that have a response time between the mean value and one standard deviation
- "2-σ range"
- shows the interval and background color used to highlight cells in the column "RT" in the results for values that have a response time greater than one but less than two standard deviations from the mean value
- "3-σ range"
- shows the interval and background color used to highlight cells in the column "RT" in the results for values that have a response time greater than two but less than three standard deviations from the mean value
- " 3-σ range"
- shows the interval and background color used to highlight cells in the column "RT" in the results for values that have a response time greater than three standard deviations from the mean value
Transactions dropped
This panel contains data about dropped transaction measurements. Transactions can be dropped because of one of the following reasons:
- the configured limit for the maximum number of simultaneous transaction measurements has been exceeded. As long as this situation exists, no measurement is performed and the number of dropped transactions is increased by one. This is done to protect against resource bottlenecks.
- upon stopping a measurement, the transaction response time is lower than a configurable limit. The measurement data is discarded and the number of dropped transactions is increased by one. This is typically done in order to protect against very large number of measurements that contribute little information with respect to the behaviour of the application.