Getting started
Getting started
This section describes how to use and find possible performance bottlenecks within your complete infrastructure. The following section describes step by step how to dig into the statistic data. Lets start with the top level view of the myarmrtsbrowser which displays on overview of different transaction statistics grouped into different application categories:
- "Arm4SDKTrac" groups any real time statistic regarding HTTP measurements of the Trac installation at https://arm4sdk.org/.
- "CDDB-Demo" groups any real time statistic regarding measurements of our CDDB-Demo running at https://myarm.info/.
- "HTTP" groups HTTP measurements of all virtual hosts running at https://arm4sdk.org/.
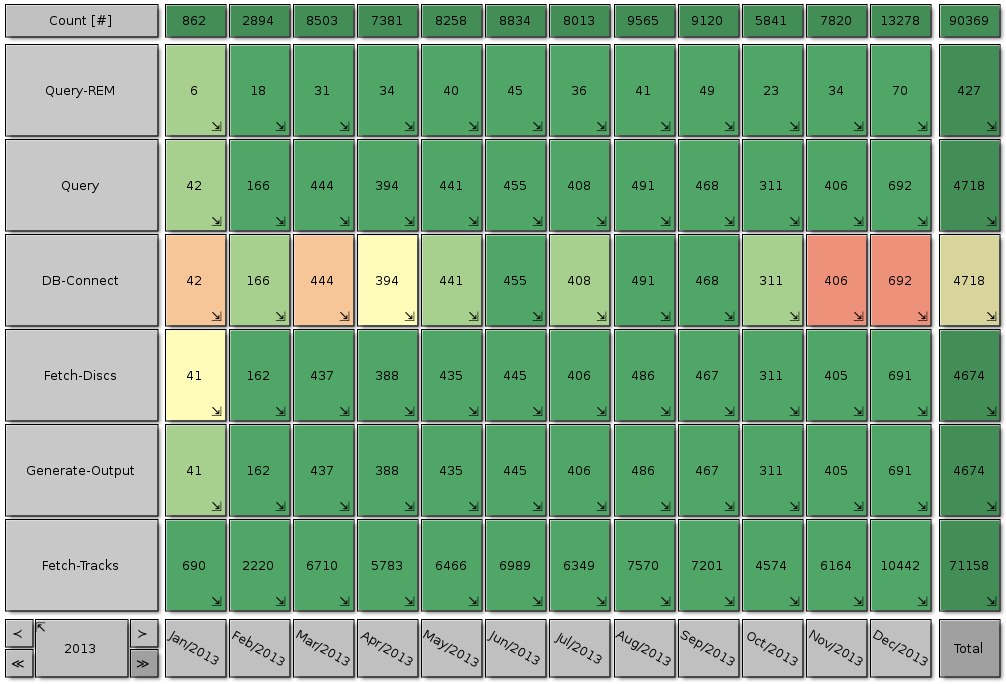
Now we will focus on our CDDB-Demo measurements and here especially the "DB-Connect" statistic since the cell is rendered in yellow indicating not optimal performance as shown in Figure "The MyARM RTS-Browser layout".
To get a better impression whats going on here we click on the "CDDB-Demo" cell within the "Row title area". This will change the view to display all real time statistics from "CDDB-Demo" group. The real time statistic names are now rendered in the "Row title area" (Y-Axis) and in the "Time period area" (X-Axis) each month of the year "2013" is displayed:
As the color indicates here the "DB-Connect" measurements are not in the range we expected. Therefore we click on the "DB-Connect" cell to dig into these measurements:
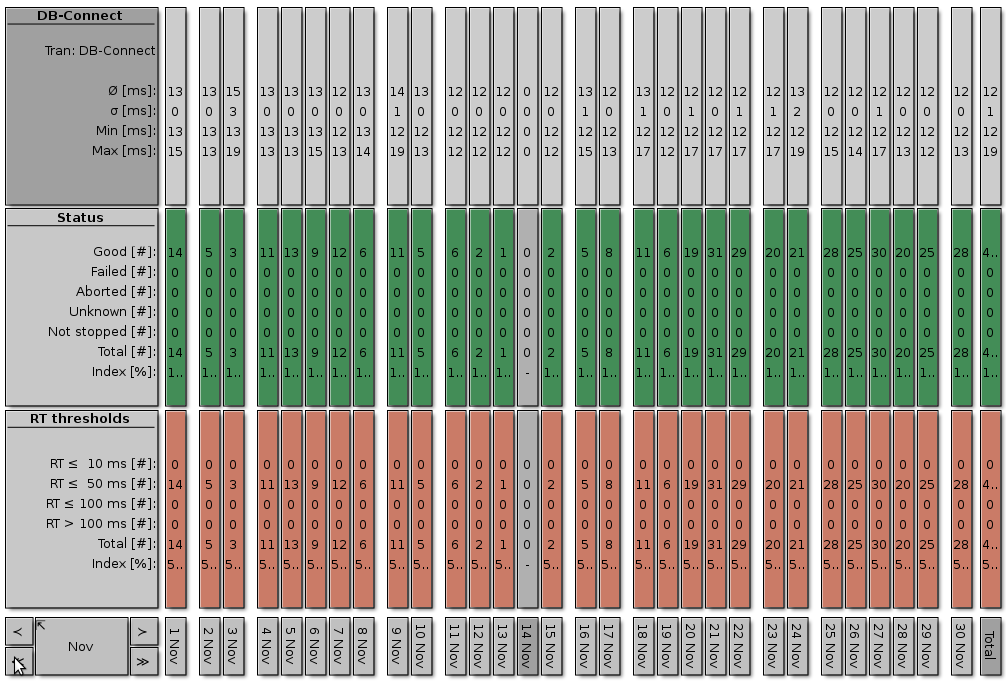
As we can see here the last two month are rendered in deep red indicating that something changed. So we will dig into the November 2013 data:
The response time threshold colors shows that the problem exists since beginning of November thus we need to browse back to October 2013:
Now we finally see that between 23th and 24th of October something changed here. Maybe a new database version was installed or the average load of the system increased since 24th of October resulting in a slightly higher "DB-Connect" response time.
Checking the MySQL database server we can see that on 24th of October 2013 something changed in the MySQL configuration:
myarm:# ls -lrt /etc/mysql/
insgesamt 24
-rw----- 1 root root  312 Jan 05 2009 15:59 debian.cnf
-rwxr-xr-x 1 root root 1198 Aug 27 2009 12:32 debian-start
-rw-r--r-- 1 root root 3972 Okt 10 2012 15:42 my.cnf.dpkg-old
-rw-r--r-- 1 root root 3972 Okt 24 2013 08:48 my.cnf.old
drwxr-xr-x 2 root root 4096 Okt 24 2013 08:48 conf.d
-rw-r--r-- 1 root root 3612 Okt 24 2013 08:50 my.cnf
After further analysis the mysql-common and python-mysqldb debian packages were upgraded which seems to cause the degradation of response times!


