
Control buttons
Control buttons
Time period
The top level view of the myarmrtsbrowser is the starting point for browsing through transaction statistics data. To define the starting time period the following time period drop-down-box is provided:
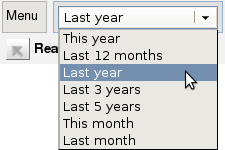
Figure: The time period drop-down-box
- "This year"
- will aggregate all available data of this year. The next drill-down level will be all month of this year.
- "Last 12 months"
- will aggregate all available data of the last 12 month. The next drill-down level will be the last 12 month.
- "Last year"
- will aggregate all available data of the last year. The next drill-down level will be the 12 month of last year.
- "Last 3 years"
- will aggregate all available data of the last 3 years. The next drill-down level will be the last three years.
- "Last 5 years"
- will aggregate all available data of the last 5 years. The next drill-down level will be the last five years.
- "This month"
- will aggregate all available data of the this month. The next drill-down level will be all days of this month.
- "Last month"
- will aggregate all available data of the last month. The next drill-down level will be all days of last month.
Cell coloring
To support identifying problematic statistics at a glance different colors are used to represent the overall statistic of the different transaction measurements. Figure "The cell coloring bar" shows all controls to adopt cell coloring:

Figure: The cell coloring bar
The following different cell coloring's based on transaction statistics are supported:
- "Neutral"
- no cell coloring
- "RT-Index"
- cell coloring according to the response time index calculated by the number of measurements within the defined response thresholds.
- "Status-Index"
- cell coloring according to the status index calculated by the number of measurements within the transaction status ("GOOD", "FAILED", etc).
With the following controls the user can slightly change the distribution of the colors:
- "Scrict"
- Interprets the selected color index real strict. Values between
0% and 60% are displayed in red, values between 60% and 70% are
displayed in orange, values over 70% in yellow and values above 80%
are displayed in light and dark green:

Figure: Strict cell coloring - "Normal"
- Values between 0% and 40% are displayed in red, values between
40% and 60% are displayed in orange, values over 60% in yellow and
values above 70% are displayed in green gradients:

Figure: Normal cell coloring - "Tolerant"
- Values between 0% and 30% are displayed in red, values between
30% and 50% are displayed in orange, values over 50% in yellow and
values above 60% are displayed in green gradients:

Figure: Tolerant cell coloring - "Linear"
- Values between 0% and 20% are displayed in red, values between
20% and 40% are displayed in orange, values over 40% in yellow and
values above 50% are displayed in green gradients:

Figure: Linear cell coloring
Time period navigation
The time period navigation buttons in the left bottom corner of the myarmrtsbrowser is used to navigate through the time line in the past and future direction. Depending on the current time period it moves the view by minutes, hours, days, months or years.
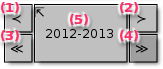
Figure: The time period navigation buttons
- By clicking this button the time view is moved by one unit into the past. For example in the hours view it moves the view by one hour into the past.
- By clicking this button the time view is moved by one unit into the future. For example in the days view it moves the view by one day into the future.
- By clicking this button the time view is moved by one complete view into the past. For example in the days view it moves the view by one month into the past.
- By clicking this button the time view is moved by one complete view into the future. For example in the months view it moves the view by one year into the future.
- Shows the currently viewed time period. By clicking this button the view is moved one level up.
Dig into raw data
Within each cell in the right bottom corner there is an arrow pointing east south. Clicking this arrow will open a new browser tab or windows and load the raw data using the myarmbrowser application as shown in the following figure.
Note that you need to configure the correct base URL for the myarmbrowser as described in section Configuring web user interfaces.
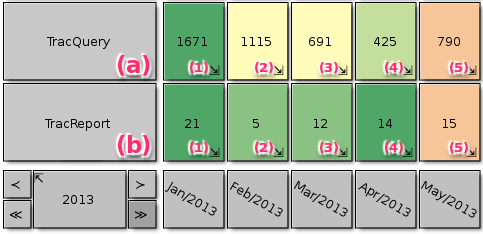
Figure: The dig into raw data arrows
- Represents all measurements for the HTTP request of the Trac
query interface:
- By clicking this button all raw
1671measurements recorded in January 2013 of the "TracQuery" are loaded into a new browser tab. - By clicking this button all raw
1671measurements recorded in February 2013 of the "TracQuery" are loaded into a new browser tab. - By clicking this button all raw
691measurements recorded in march 2013 of the "TracQuery" are loaded into a new browser tab. - By clicking this button all raw
425measurements recorded in April 2013 of the "TracQuery" are loaded into a new browser tab. - By clicking this button all raw
790measurements recorded in may 2013 of the "TracQuery" are loaded into a new browser tab.
- By clicking this button all raw
- Represents all measurements for the HTTP request of the Trac
report interface:
- By clicking this button all raw
21measurements recorded in January 2013 of the "TracReport" are loaded into a new browser tab. - By clicking this button all raw
5measurements recorded in February 2013 of the "TracReport" are loaded into a new browser tab. - By clicking this button all raw
12measurements recorded in march 2013 of the "TracReport" are loaded into a new browser tab. - By clicking this button all raw
14measurements recorded in April 2013 of the "TracReport" are loaded into a new browser tab. - By clicking this button all raw
15measurements recorded in may 2013 of the "TracReport" are loaded into a new browser tab.
- By clicking this button all raw