Drill down
Drill down
The myarmrtsbrowser main concept is to drill down from a top level view into details about various transaction statistics. To do so the myarmrtsbrowser provides a drill down for defined time periods.
The group view
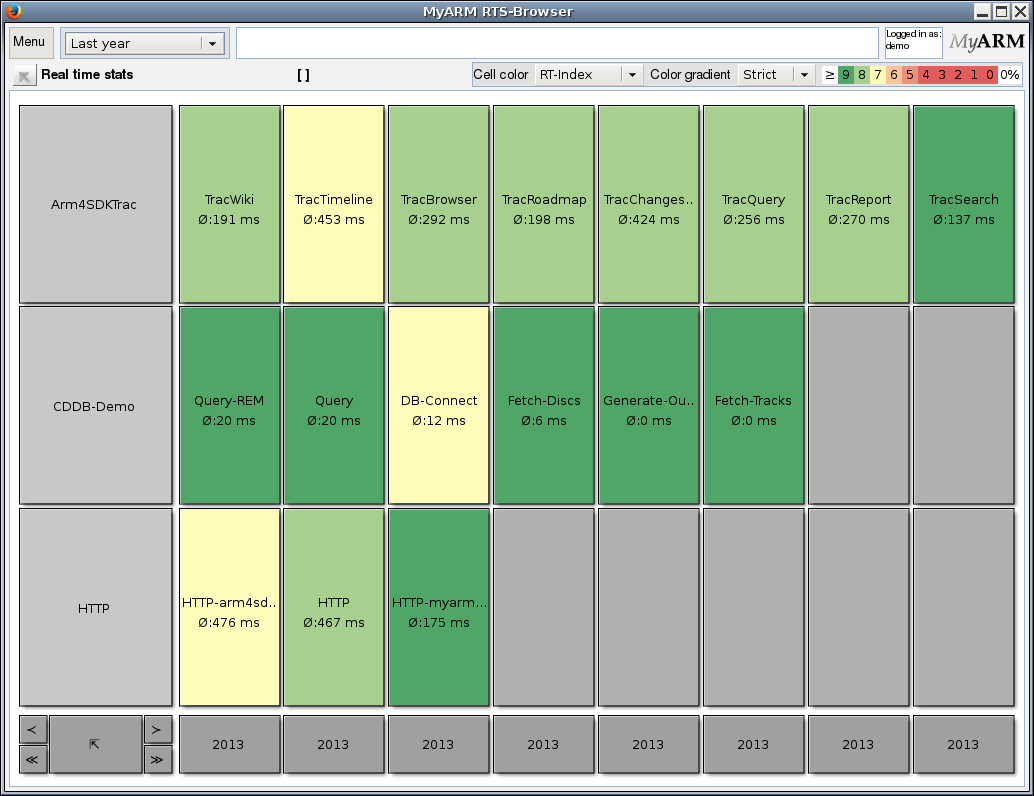
The starting point is the top level view also called "RTS Group view". The time period for this view can be specified using the "Time period" drop-down-box. Within our example we used "Last year" ("2013"):
Depending on the selected "Time period" the next drill down level will show years or months.
The years view
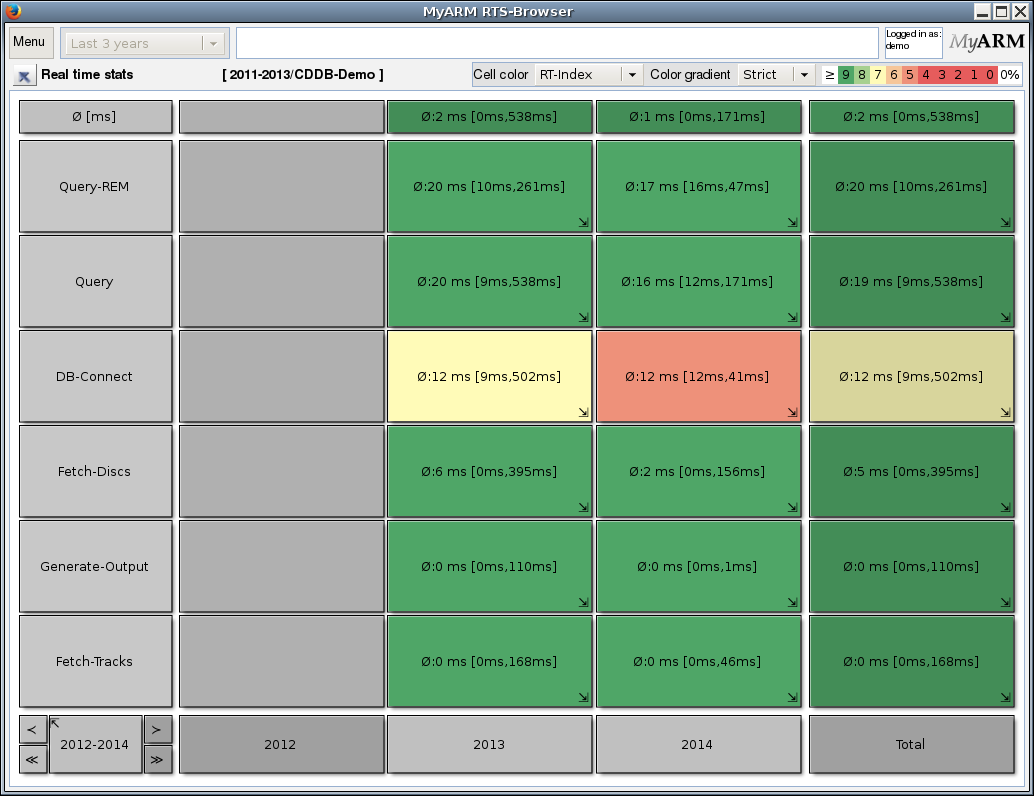
The following example shows the years "2012" until "2014":
The year "2012" has no data therefore the cells are rendered in dark gray. For the years "2013" and "2014" the average and in brackets the minimum and maximum response time is presented.
The months view
To further drill down we clicked on the "2013" cell. The following figure shows data from "December 2012" until "November 2013" since we moved the view by one month into the past be clicking the "<" in right bottom corner:
We know that there is no data within "2012" the cells for "December 2012" are rendered in dark gray.
The days view
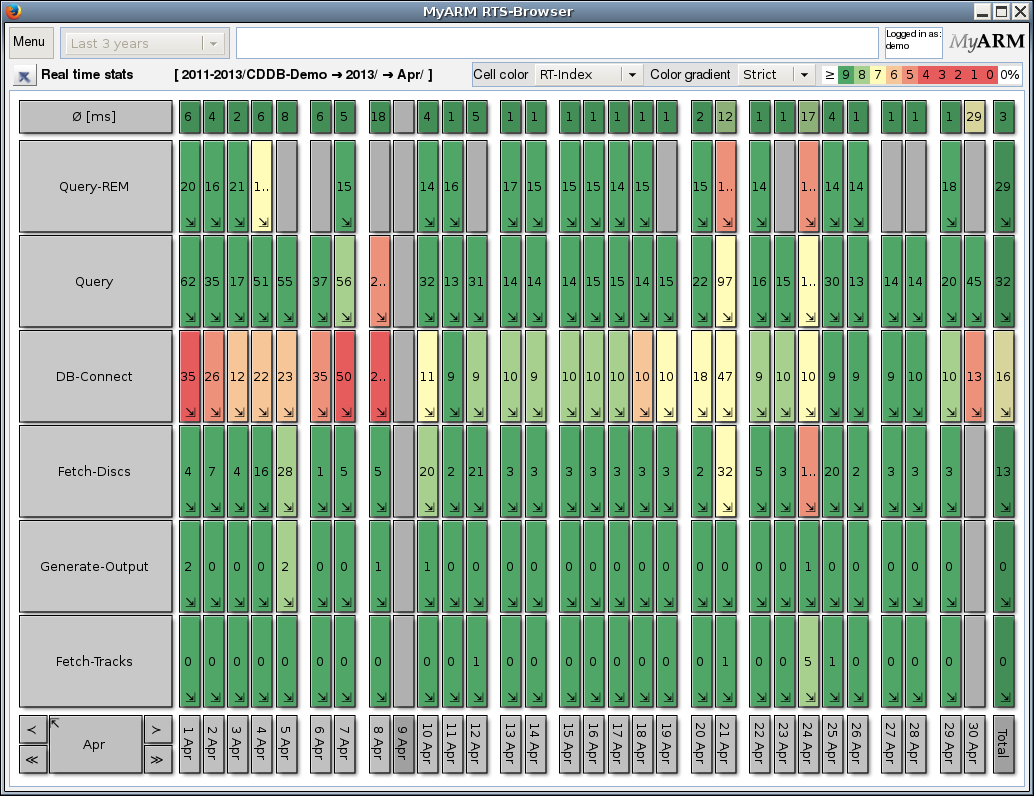
Now we pick up "April 2013" to step deeper into the data:
Within the days view there are two days rendered with slightly more space between the other days. These two days are "Saturday" and "Sunday". Therefore its possible to see the difference between working days and the weekend at a glance.
The hours view
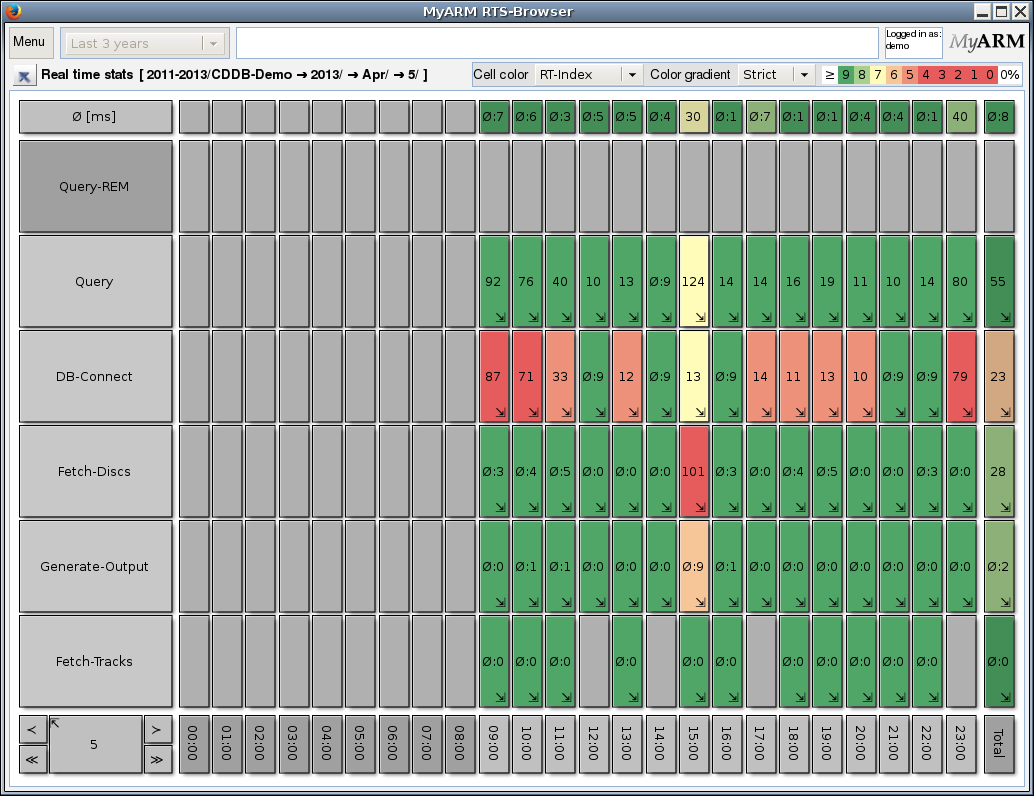
We drilled down into "5th April" and we can see here measurements are recorded after 9am until 12pm and this days no one searched for REM within our CDDB-Demo.
The minutes view
The last time period view is the minutes view and here we selected "15:00" (3pm):
The details view
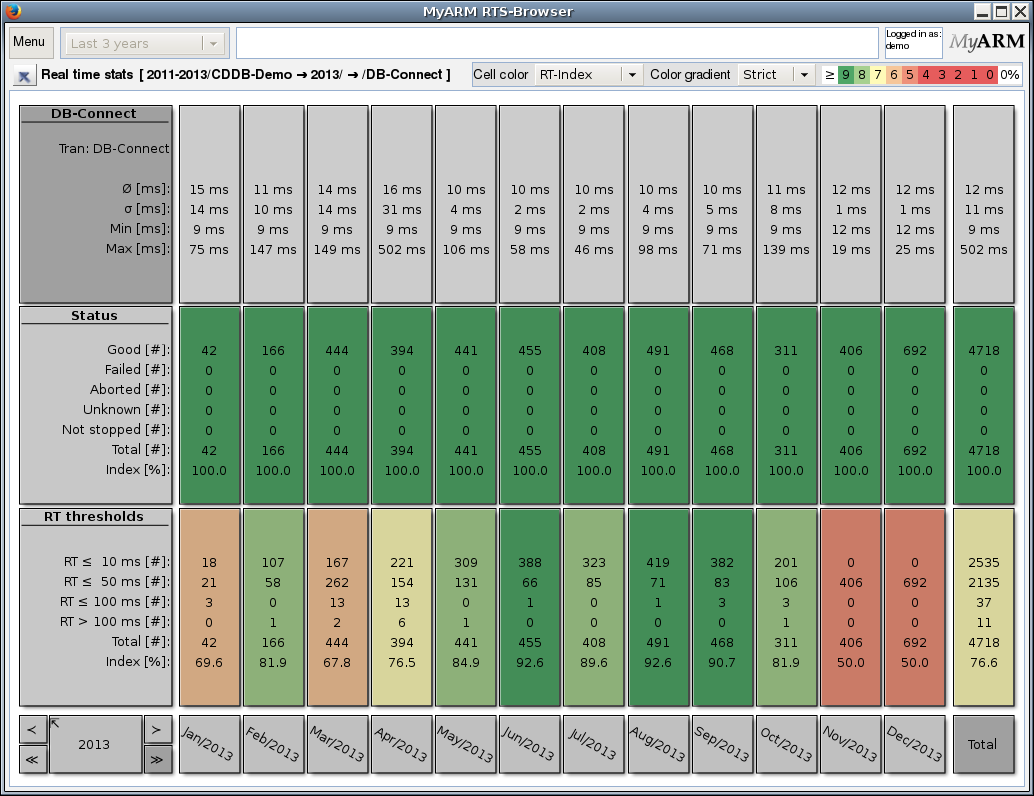
Within any time period view it is possible to drill down to the details view by clicking on the "DB-Connect" in the "Row title area". The following example shows the details of "2013":

