Tree view
The tree view area
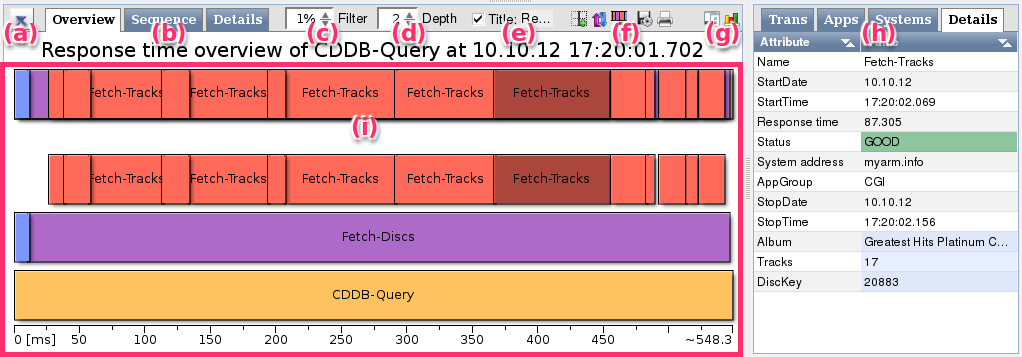
The diagram area at the lower part of the MyARM web browser interface will show you graphical representations of measurements. Following is a short description of the various parts making up the tree view and its associated sidebar:
- The loading button: load parent and sibling transactions in order to analyse transaction trees
- The tabs "Overview", "Sequence" and "Details": toggle between three different graphical representations of the transaction tree
- The percentage filter: consider only transactions with response times over a certain threshold
- The tree depth: the maximum number of levels to analyse in the transaction tree
- Title editing: the title checkbox is used to enable (checked) or disable (unchecked) drawing of a title within the diagram. If enabled the title text can be changed by clicking the text rendered in light gray beside the title checkbox. A line edit will be displayed allowing to change the title. To discard changes press escape, to confirm changes just press the return or enter key.
- The tree view icon bar: for printing and exporting diagrams,
showing a grid, etc:

- Toggles the grid rendering within the "Overview" diagram

- Toggles the "Overview" orientation from bottom-up to top-down and vice versa. The default is to draw the transactions bottom-up. If changed, the level of transactions are drawn top down: the root transaction is then displayed at the top of the canvas, child transactions are shown below.

- Switches a so-called overlay rendering on and off. If switched on, a box representing the root transaction will be shown into which the child transactions are drawn superimposed. This is also the default.

- Clicking on this item will download the current diagram as a SVG file.

- Clicking on this item will open the diagram in a new browser window for printing. You can then print this diagram directly via your web browser menu.
- The tree view sidebar icon bar: to toggle the visibility and
contents of the sidebar displayed at the right side of the tree
view

- Clicking on this icon will hide the sidebar and clicking on
this
 icon will show the
sidebar again.
- Indicates the sidebar statistical information mode. Clicking on
the icon will switch to the
 icon indicating the speedup sidebar mode.
- The tree view sidebar: additional information for the tree displayed in the tree view
- The tree view diagrams: graphical representation of the tree view according to the tab selected
The following sections describe each of the parts in more detail.
Loading the parent and sibling transactions
Clicking on a result row will initially show you only the
selected measurement and its siblings. If you want to see a
graphical representation for the parent transaction and the
transactions siblings, click on the button ( ) in the upper left corner (Figure "Figure: The tree view area
overview": "a") as shown here:
The related transactions are loaded from the database and all of
the visible diagrams are updated immediately. If current root
transaction has no parent transaction the button ( ) is disabled.
Setting the percentage filter
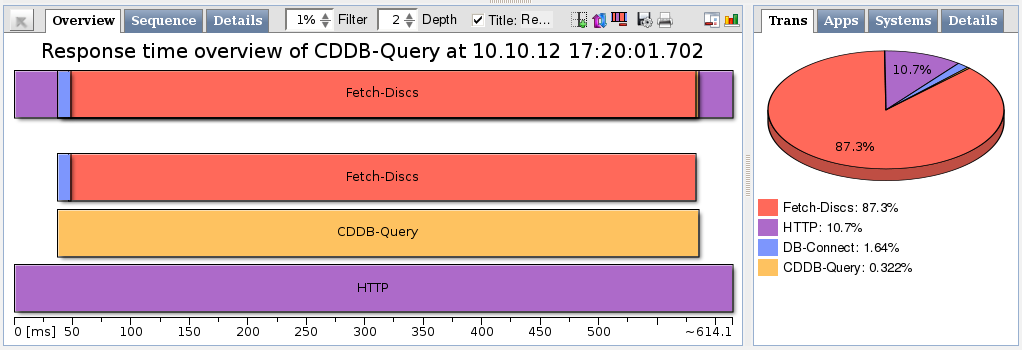
By changing the value in the spin-box labelled "Filter" (Figure "Figure: The tree view area overview": "c") you can omit all transactions with a response time less than the percentage of the total time from being used in any of the diagrams. Please note that this will discard whole transaction types if they account for only a small percentage of the total response time. The two following screen shots illustrate this fact, the second screenshot raises the percentage to two percent, thus skipping the transaction type "DB-Connect", which accounts for only 1.64% of the response time.
Setting the tree depth
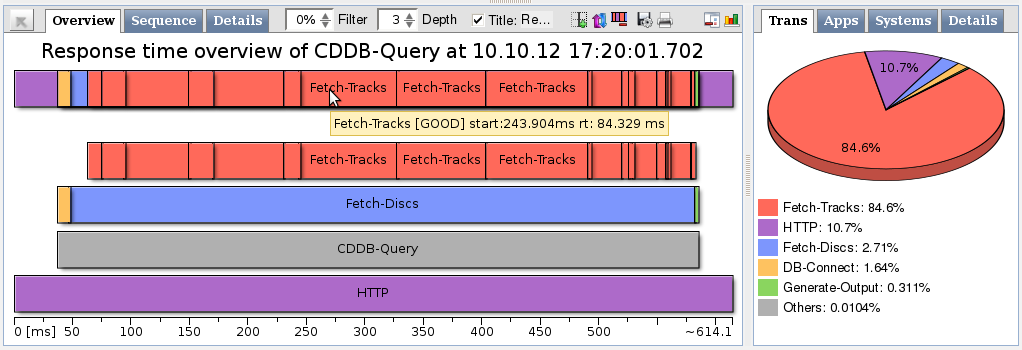
The value in this spin-box (Figure "Figure: The tree view area overview": "d") determines how many levels of transactions are loaded and shown. If a number of 4 is set as tree depth, up to 5 levels of parent-child transactions are loaded and displayed. The following two screen shots illustrate the additional level shown when increasing the tree depth from two to three:
As you can see, increasing the tree depth added a new transaction type "Fetch-Tracks", accounting for 84.6% of the total response time.
The "Overview" tab
Measurements related to a transaction are drawn as rectangles
(Figure "Figure: The
tree view area overview": "h"), labelled with the
transaction name. At the lower edge, an axis is shown together with
the unit used. By default, you read the diagram from bottom to top
(the order can be reversed by clicking on the  icon): the root transaction is drawn
bottommost and starts at 0ms. The length of the box represents the
whole response time. Boxes drawn above another transaction indicate
their start time and their stop time by being drawn relative to the
transaction below. If there is enough space, the transaction name
will be written in the centre of the box.
Colors are used to differentiate between transaction types but also indicate how much net response time has been used by the particular transaction time. Transactions which account for most of the net response time are drawn with a red background color. Those with the next higher response time sum will be drawn with a lilac background color. The same holds for colors blue, yellow and green, in this order.
Child transactions are drawn superimposed on the topmost box for
additional reference if icon  is shown. Clicking on this icon
will hide the so-called overlay boxes. This box also delivers the
best intuitive understanding of net response times by comparing how
much area is taken up by the different colors. It differs from the
pie diagram on the right by also showing the order in which the
measurements happened.
The following figure depicts the diagram from top to bottom without the so-called overlay boxes:
The "Sequence" tab
This tab shows a sequence diagram for the same data as in the tab "Overview":
The following areas can be identified within the sequence diagram:
- The sequence diagram
- The box represents the host all transactions were executed on, here the "myarm.info" host
- The box represents the Apache-HTTPD-Server process ("httpd")
- The box represents one thread within the "httpd" process
- The box represents the CDDB CGI process ("PyCDDB")
- The box represents one thread within the "PyCDDB" process
- The boxes represents a transaction measurement which can be selected (the box will be rendered darker) to show details in the sidebar "Details" tab. Also its possible to double-click a box to use the double-clicked transaction as the new root of the transaction tree
- The sequence diagram title. Click the text to change it
- The sequence diagram icon bar

- Hides or shows (
 )
system (hosts) boxes within the sequence diagram. This box will be
labelled with the system address.
- Hides or shows (
 )
application boxes within the sequence diagram. The boxes will be
labelled with the corresponding ARM application names.
- Hides or shows (
 )
thread boxes within the sequence diagram for each thread,
containing the ARM transactions.
- Hides or shows (
 ) root
transaction context attributes
- Render texts left aligned or centred (
 )
) 
- Hides or shows (
 )
transaction measurement legend explaining which colors have been
used for which transactions.
- Clicking on this item will download the current diagram as a SVG file.

- Clicking on this item will open the diagram in a new browser window for printing. You can then print this diagram directly via your web browser menu.
- The transaction context properties of the root transaction in the sequence diagram
- The legend of the sequence diagram describing which color corresponds to which transaction
The layout can also be changed by using the mouse wheel which will expand or collapse the diagram horizontally for better legibility.
The "Details" tab
This view shows the parent-child relations of the transactions by indentation. In the example screenshot, the parent transaction is named "HTTP". It has one child transaction (indicated by the indentation to the right) named "CDDB-Query", which itself has two child transactions: "DB-Connect" and "Fetch-Discs". "Fetch-Discs" itself has several child transactions of the type "Fetch-Tracks".
Each line representing a measured transaction shows several columns:
- "Identification"
- is the ARM transaction name.
- "AppName"
- is the ARM application name.
- "StartTime"
- is the Transaction start time.
- "RT"
- is the Transaction response time.
- "%"
- is the proportion of the Transaction response time as compared with the total response time of the root transaction.
- "Net RT"
- is the share of the response time without the response time taken up by child transactions.
- "%"
- is the proportion of the net response time as compared with the total response time.
- "Status"
- is the ARM Transaction status.
- "System address"
- is the ARM system address.
The tree view sidebar
The contents of the sidebar are determined by the mode as
triggered by the rightmost icon in the tree view icon bar. If
statistics mode has been selected ( ), statistical information is provided
via four tab panes:
The tabs in this sidebar mostly show pie charts regarding statistical information for all measurements displayed in the tree view. Thus, they are always related to the total response time as determined by the start and stop times of the root transaction.
- The tab labelled "Trans" shows a pie chart with the proportion of the different transactions. The numbers show the percentage of the particular transactions net response time compared to the total response time.
- The tab labelled "Apps" shows a pie chart with the proportion the different applications.The numbers show the percentage of the particular applications net response time compared to the total response time.
- The tab labelled "Systems" shows a pie chart with the proportion of the different systems. The numbers show the percentage of the particular systems net response time compared to the total response time.
- The tab labelled "Details" shows a table with transaction attributes of the selected transaction from the tree view "Details" tab.
The tree view speedup diagram
If speedup mode has been selected ( ), information regarding the
calculated speedup is provided via two tab panes:
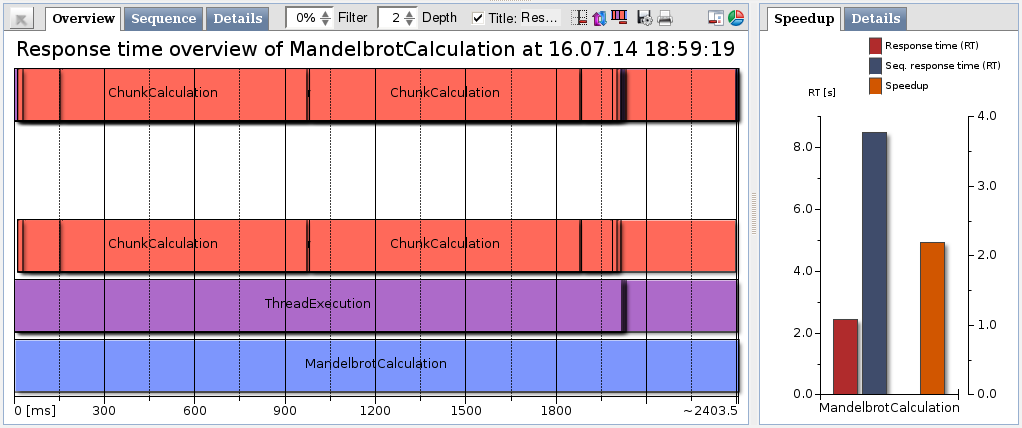
The tab labelled "Speedup" shows you information regarding the calculated speedup for a measurement as compared to the response time which would have resulted if none of the transactions in the tree could have been executed in parallel. The numbers are illustrated in the diagram by three bars (possibly real and sequential response time with the same height if no speedup can be calculated).
We use the following definitions to calculate the Speedup:
- The "Response time" is the measured response time of the selected transaction, as measured from start till end.
- The "Sequential response time" is the sum of all response times as reported for the child transactions, thus ignoring activities that happened in parallel.
- The "Speedup" is calculated as follows: TSeq * C / (TSeq + TMax *
(C - 1)), where
- TSeq
- is the sum of all asynchronous response times of the child transaction
- TMax
- is the maximum response time of all children
- C
- is the concurrency as specified in the transaction metrics (or concurrency property, if no concurrency metric has been provided)
In the example above, the user had provided a concurrency of
4 (as you can verify in the next screenshot, showing
details for the current tree). By further inspection of the details
(or hovering the mouse over some of the boxes) we find out that
TSeq equals 8470 ms
and TMax is 2359 ms
(rounded). So, the longest child transaction took 2359 ms,
whereas the whole measurement would have been at least
8470 ms if there were no parallel processing. Plugging
those numbers into the equation yields a speedup of about
2.18.


