Layout
Layout
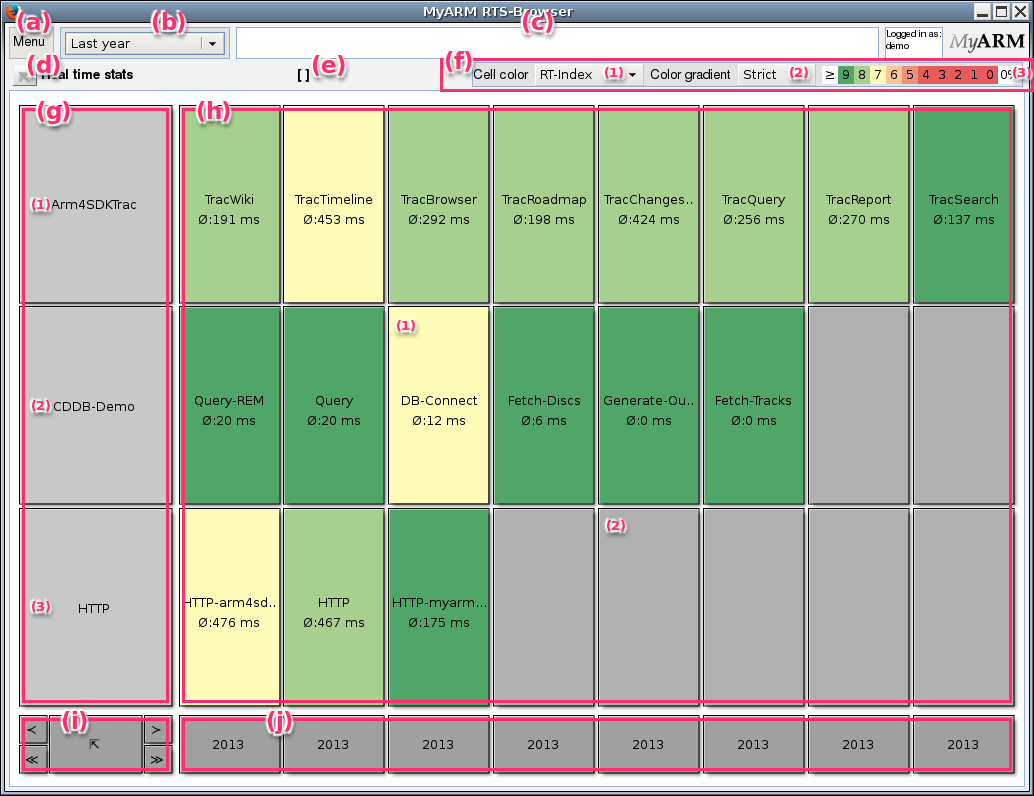
The user interface is really easy to use, the following paragraphs will give you an overview over the different parts in the GUI and this is how a MyARM RTS-Browser web interface looks like:
- The "Menu" is used to change settings that affect the whole application such as changing your user name and preferences for displaying data. Those preferences can be saved and loaded from the database.
- Within the top-view of the myarmrtsbrowser a time period can be selected to start browsing the real time statistics. Here the "Last year" ("2013") is selected. See the "Time period" drop-down-box for details.
- The "Status-Line". Error messages related to processing your request and also informational messages (loading data etc.) are displayed here.
- The
 button is used to go a
level up if current view was drilled down.
 - Within the brackets the complete drilled down navigation path is displayed.
- The "Cell color area" is used to select the coloring of
the transaction data cells:
- The cell color drop-down-box to select the used statistic index for coloring the transaction statistic cells ("h"). Here the "RT-Index" response time index is used.
- The cell color gradient drop-down-box is used to select the strength of the chosen coloring. Here the "Normal" color gradient is used.
- The color gradient bar displays the current coloring distribution from left greater than 0% to right greater than 90%.
- The "Row title area". Depending on the current level
general information is displayed in each cell. Within the top group
level the cells displays the names of RTS groups:
- "Arm4SDKTrac" groups any real time statistic regarding HTTP measurements of the Trac installation at https://arm4sdk.org/.
- "CDDB-Demo" groups any real time statistic regarding measurements of our CDDB-Demo running at https://myarm.info/.
- "HTTP" groups HTTP measurements of all virtual hosts running at https://arm4sdk.org/.
- The "Transaction statistic area". Depending on the
current level statistics are shown for a specific transaction
within a defined time period as shown in ("i").
- "DB-Connect" shows statistic information about the database connection measurement within the our CDDB-Demo.
- Empty cells where no data exists are rendered in a gray color.
- The "Time period navigation area". Within this area buttons are provided to navigate through the time line of measured statistics. Cells rendered in dark gray color are disabled and can not be clicked since there is no data. See the "Time period navigation" buttons for details.
- The "Time period area". The cells in this area are used to drill down and select the displayed time period.

