Layout
Layout
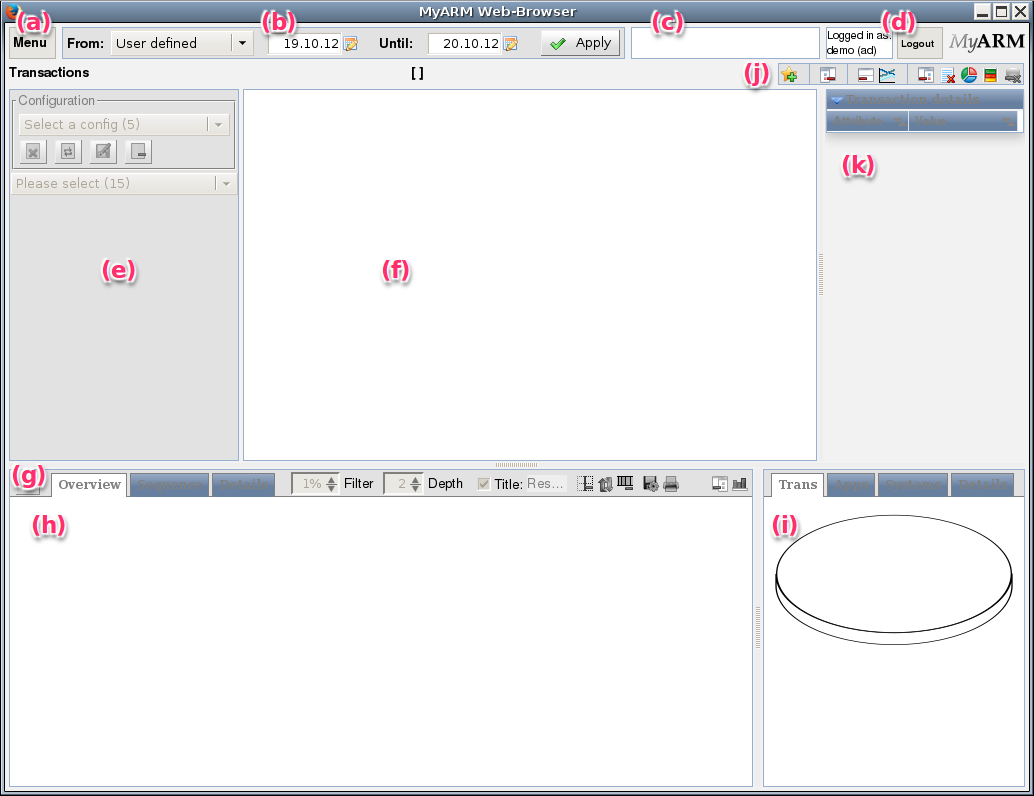
This is how an (initially) empty MyARM Browser web interface looks like:
The user interface is really easy to use, the following paragraphs will give you a short overview over the different parts in the GUI. Every part will get a detailed description later on.
- The "Menu" is used to change settings that affect the whole application such as changing your user name, the granularity of your selection (one day/several days) and preferences for displaying data. Those preferences can be saved and loaded from the database.
- By modifying the date and time fields you can choose the interval you want to analyse. If you have decided to analyse several days ("Menu / Date selection") only the date text field is shown.
- The "Status-Line". Error messages related to processing your request and also informational messages (loading data etc.) are displayed here.
- The "User info and logout boxes". Within the user info box the currently logged in user is shown (here "demo", the suffix "(ad)" indicates that the user has administration rights). The logout box is used to log out the current user. A simple log in dialog is shown (See "The admin user").
- The "Selection area". This is where you select the order in which ARM-related data are selected and displayed. You can export those settings into a file in order to reuse these settings later on (this is why you see the text "select a config"). Generally, the contents in the selection area will be specific to the order selected.
- The "Result area". This area will display a list of measurements. You can click on each line displayed in order to get even more details.
- The "Bottom view area". Is used to display additional
(mostly) graphical information about currently loaded measurements.
Depending on the graph icon state (
 /
/  ) within the "Icon bar area" a
tree representation is displayed of the currently selected
transaction or a scatter diagram of all loaded transactions is
presented.
 - The "Tree area". This is where (mostly) graphical output is displayed, always related to a single selected measurement.
- The "Diagram area". This will show the distribution of Transactions, Applications and Systems within a transaction tree in percent.
- The "Icon bar area". The icons provide shortcuts to frequently used actions.
- The "Sidebar area". This will show details and summaries of the transactions within the "Result area".

